


As a kid, I'd get random brief interviews from everyone and anyone. 'Who do you want to be when you grow up?' I'd giggle and say a fire-fighter. I didn't know what that entailed really but I had an answer and it was a strong one. We all had one, that long-lost love of ours, for most.
In the recent past, I've come across so many Data Science posters across campus and even in the streets. But who exactly is a Data Scientist and how do you become one? It can be difficult trying to learn a new thing without a clear path. However, this difficulty can be mitigated by creating and implementing a solid educational plan, in other words, a roadmap.
What is DS?
Data Science is the art of uncovering the insights and trends that are hiding behind data. The goal of data science is to get insight. It is inclusive analysis and takes into consideration all the data to come up with the most insightful and compelling answer to your research.
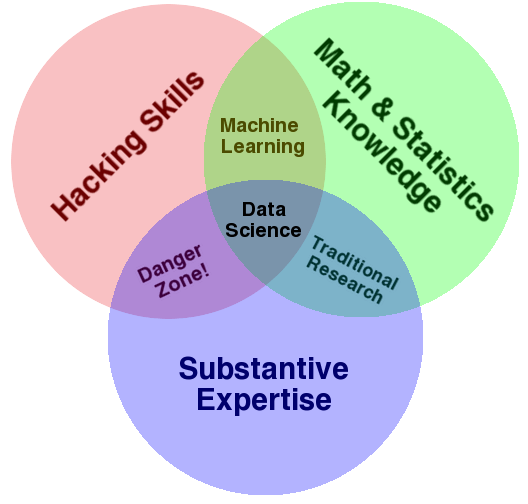
Data Science is a blend of mathematical, computational, and domain knowledge. Since it involves building predictive models and creating data-driven solutions to complex problems one has to have a proper understanding of the involved field. A good percentage of people are actually doing their studies and then going to work in the research bit of it instead of practicing.
What is a DS Roadmap?
A roadmap is a strategic plan that defines a goal or the desired outcome and includes the major steps or milestones needed to reach it.
On the other hand, DS, according to this article, is:
" the art of uncovering the insights and trends that are hiding behind data."
Therefore, a DS roadmap is a visual representation of a strategic plan designed to help aspiring IT professionals learn about and succeed in the field of data science.
Data Science Tools
Programming languages: Python, R, and SQL
Machine learning libraries: TensorFlow, Keras, and Scikit-learn
Data visualization tools: Visualization tools like Tableau, Power BI, and Matplotlib
Data storage and management systems: Databases like MySQL, MongoDB, and PostgreSQL
Cloud computing platforms: AWS, Azure, and Google Cloud Platform
Mastering DS requires an understanding of these sections:
Applied Statistics and Mathematics
Data science careers require mathematical knowledge to obtain insights from big data as well as training models using various ML algorithms that require a strong base of mathematics.
Probability
Probability is a field of mathematics dealing with numerical representations of how likely an event will occur or not. Various probability types are used in decision trees and the Bayes theorem for machine learning.
Calculus
Calculus is a field of mathematics concerned with the determination and characteristics of derivatives and integrals of functions using methods based on the summation of infinitesimal differences. The concept of gradient descent is an important aspect of machine learning and deep learning.
Linear Algebra
Linear algebra is a field of mathematics involving linear equations, vectors, matrices, operations, sets, logarithms, exponential functions, eigenvalues, eigenvectors, etc. It's difficult to think of many models that don't need calculations based on linear algebra.
Statistics
Statistics provides an easy method to summarise, analyze, and visualize data in various formats.
Descriptive Statistics
This is the initial stage in analyzing quantitative data that can be easily visualized using graphs and charts. Helps us gain a rudimentary knowledge of data.
Inferential Statistics
More subjective and difficult to understand than descriptive statistics.
It has 2 main objectives:
Estimating parameters: Making estimates about populations.
Hypothesis Testing: Assessing relationships between variables.
Coding
This is the most important component of DS. Coding concepts are required for every activity in DS.
Data Structures
It is essential to understand the concepts of arrays, linked lists, stacks, queues, hash tables, trees, heaps, graphs, and schemas.
Control Structures
These are important for an application's workflow.
OOp Concepts
Most programming languages are object-oriented, making storing similar types of data simple.
Python
Python is extensively used in scientific and research groups because it is simple and has simple syntax. The most important Python libraries for data science are NumPy, Pandas, Matplotlib, and Scikit-learn.
R
R is also a powerful language, just like Python. For classification, clustering, statistical testing, and linear and nonlinear modeling, R includes a wide range of statistical and graphical tools. The top R libraries are as follows:
dplyr: The dplyr package is used for data wrangling and data analysis. This package is used to perform various tasks with the R’s dataframe. The five functions Select, Filter, Arrange, Mutate, and Summarize form the foundation of the dplyr package.
Tidyr: The tidyr package is used for cleaning or tidying up data.
ggplot2: R is well known for its ggplot2 visualization package. It offers an interesting collection of interactive graphics.
Python is easier to understand and more readable. If you are from a coding background, you can opt for R, too, as it has better libraries and tools for data analysis and visualization.
SQL
At the database level, SQL makes it simple to write queries and perform data grouping, selecting subsets of data, filtering, joining, merging, sorting, and other operations.
In SQL, it is important to be familiar with:
Group By Clause: The SELECT statement and the SQL GROUP BY clause are used together to group similar pieces of data. Along with the group by clause, the Having Clause applies conditions.
Aggregation Functions: An aggregate function adds together multiple values to produce a single value after performing a computation on them. For example, count, average, minimum, maximum, etc.
Joins: This is a key topic that combines several tables to provide the necessary results. Ensure you understand the different join types, main, foreign, composite, etc.
IDE
JupyterLab
JupyterLab is an open-source web application that provides a user interface based on Jupyter Notebook.
Spyder
The Scientific Python Development Environment (Spyder) is a cross-platform, open-source IDE for data science.
Atom
Atom is a powerful ML & DS IDE that supports several languages other than Python, including C, C++, HTML, JavaScript, and others.
There are many other popular IDEs including Visual Studio code that have great capabilities.
Projects
Hone your skills by working on projects and deploying them. The projects will prepare you for real-world Ds projects on a smaller scale.
Assess yourself regularly by doing quizzes and assessments and seeing if you can easily answer them. This will help you identify your weak points and build confidence in what you know.
Upskill oneself and keep abreast with ever-changing technology.
There are numerous resources out there. With dedication, it is possible to build a career in DS.